Climate change impact of Food & Bev at events? It’s something we need to get straight.
The original article was published by Meegan Jones on Linkedin here.
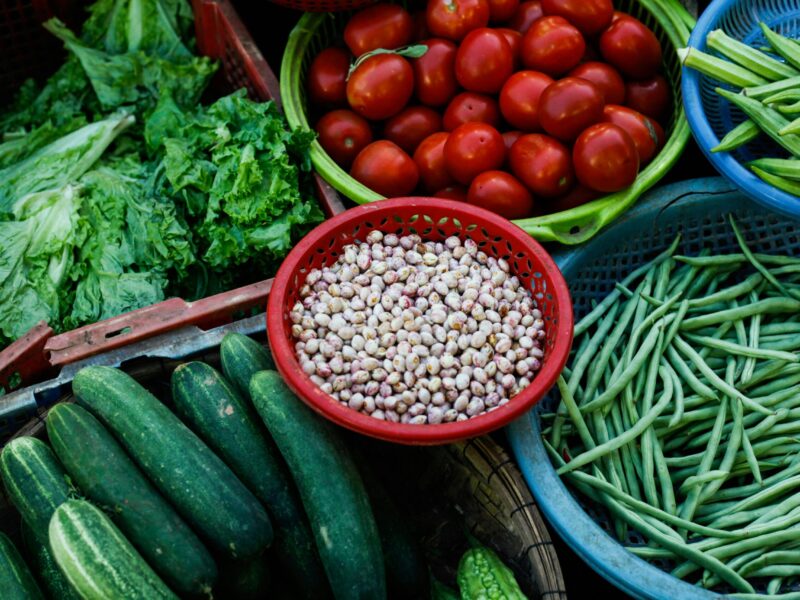
Food and beverage is at just about every event, and we know that what we choose to serve comes with a legacy of greenhouse gases. But whether to include F&B in your event’s carbon footprint, and just how to go about it, is something we need to get straight.
Reducing GHGs of course is key, and regardless if or how you measure, there are steps we can take to reduce the climate impact of serving and selling food at events.
We’ve heard that eating less or no red meat could halve a carbon footprint. And that food grown in hothouses, highly processed, packaged and long-travelled food can have big GHG impacts compared to fresh and local. We’ve even heard reports of lamb produced in New Zealand and sold in the UK might have a lower footprint than lamb raised in the UK.
The truth is though, without a complete Life Cycle Analysis (LCA) of every ingredient or category, considering your destination and food sourcing, and including local transport, it’s hard to compile hard data. And so we work in a world of assumptions and extrapolations. And that’s OK.
A short-cut’s needed though… So us busy event managers can save precious time while we save the planet.
While event planners are always short on time, we’re big on processes, checklists and formats. And so we would benefit from a simple guide and set of decision filters to help define the best approach to measuring F&B GHGs for our event context.
How are we doing it at the moment?
Good question.
I’ve scanned our industry to uncover how various events and consultants are measuring food and beverage GHGs. Some commonalities have been revealed, but also a lot of variety in the level of detail, how to gather that data, and foundation metrics or GHG emissions factors used.
This summary is intended to start the conversation in our industry with a view to establishing an agreed approach, which importantly can lead to industry benchmarking, making measurement even simpler for all.
Here’s the upshot of what I asked the movers and shakers in events and GHGs.
Do you include F&B in your event’s GHG Inventory?
Many do include it, but take a lot of different journeys to get to the final GHG number. I got some no’s too – no we don’t include f&b GHGs.
Here’s some of the reasons why they wouldn’t measure:
- No, people would be eating anyway. We do all we can to reduce (e.g. high proportion of vegetarian) but we don’t include this in our footprint measurements.
- No, it’s just too hard to gather accurate data, we don’t have the resources to measure it, and so we work on taking action on reductions instead of the time it takes to measure.
- No, because we’ve estimated that the proportional impact is tiny, compared to others, so we focus on measuring those other areas.
Whether to actually measure F&B GHGs or not, could be part of our decision filters, along with what could be the additional impacts of eating at an event, compared to the usual daily personal consumption.

How do you measure F&B GHGs?
This was an interesting one, and a variety of approaches were taken.
Some have just gone for it, right down to the ingredients used in every meal served on the menu across all food outlets. Others go by the number of meals. Others the weight of food.
Some pre-estimate the proportion of the footprint that F&B could be, in order to decide how deep a dive is taken into data gathering and accurate analysis.
Instinct, estimations and experience are very good tools to hand here – but again, we could look to creating a common set of questions to create decision filters to help decide on the approach.
Here’s some basic explanations of approaches taken:
- Per meal basis: Estimate the number of meals, snacks or beverages per day and multiply it by various ‘per meal’ emissions factors.
- Per meal basis: As above but with meal types included, such as percentage of vegetarian. Events or caterers/food vendors would provide the number of meals served.
- Weight basis: Estimate the number of meals, apply an average weight (some did 450gm, others 500gm, and one USA respondent upgraded that for bigger meals consumed there!) This was then multiplied by a kg-based emissions factor.
- Food category basis: Looking across the entire menu, estimate the volume/weight/proportion for each ingredient category (e.g. beef, seafood, dairy, vegetables, pasta, rice, bread) and extrapolate by published emissions factors.
- Ingredient basis: For every meal prepared by each caterer, analyse the ingredients, extrapolate the volumes and apply an ingredient or category emissions factor.
- Per snack: Number of snacks estimated and a standard emissions factor applied.
- Per beverage: Amount of beer, wine, non-alcoholic beverage, packaged water, per person (often in litres), multiplied by category emissions factor. Interestingly in the IOC guidance, tea and coffee was not defined as a separate category.

Now what about the ‘emissions factors’?
This is where things get wild. The ‘emissions factor’ is the coefficient applied per item – in this case, how many GHGs are created for a volume or weight of ingredient, category or per meal or drink.
To measure the GHG impact of a certain ingredient or category, there needs to have been an LCA done. There’s a lot of LCA’s on many ingredients and categories, and there are also some massive assumptions and extrapolations. But we have to start somewhere.
Sources of emissions factors can be from suppliers on their specific item, or national or international emissions factors prescribed, whereby various industry data is fed into establishing the agreed factor. In some cases calculators that have their own cascade of emissions factors sources are used.
I asked events and consultants how they do their numbers wrangling. Here are key approaches from most detailed to most general:
- Caterer Specific: Require caterers/food vendors to calculate their meal’s footprints using CarbonCloud (Source of factors: CarbonCloud uses benchmark data and verified data from specific suppliers.)
- Meal or Menu Specific: Event reviews the menu and meals and estimates the proportion and volume of each ingredient or category and uses CarbonCloud for emissions factors, WRI’s Cool Food Pledge Calculator, or the WARM15 (US EPA’s Waste Reduction Model) which has sections on food categories.
- IOC Pre-Estimations: Historic data has enabled the IOC to establish per meal, per snack and beverage based emissions factors. (Source of factors: World Food LCA Database WFLDB 2015. Calculated factors to use and assumptions are detailed in the IOC’s Methodology.)
- IOC Actuals: Requires actual amounts to be calculated (i.e. not use the assumptions such as two meals per day or per meal average emissions). The sources of emissions factors and methodologies for calculating actual impacts are the domain of each organising committee, to allow for destination and event context.
- By Weight: Using the number of meals x average weight, or other ways to estimate total weight, then multiply by the DEFRA emissions conversion factors/UNFCCC source for food per kg.

Other Concerns, Considerations and Opportunities?
Everyone agreed that it would be extremely beneficial to publish a guide, ready-reckoner, and methodologies for approaches to food & beverage GHG accounting for events of various types. This would fast track and simplify the approach for many in the events industry just starting out in measuring their GHG impacts.
It was noted that price and effort required to get specific data is often unmanageable by most smaller organisations, and so having industry guidance for an easier way is warranted. There is interest in a ‘per meal’ approach being established that is acceptable for applying as industry averages for those who don’t have the resources (time, people, expertise) to use a tool such as CarbonCloud.
Portion size seems to vary between UK/Europe and USA. May need an ‘uplift factor’ for the USA in terms of volume!
A simple resource to show food GHG hotspots and what to look out for – so that menus can be more easily designed to look for a 50% GHG reduction would also be valuable.
Energy used in Food Prep: Onsite energy use in kitchens would be already included in the event’s data. However any significant offsite prep for the event could be considered for additional measurement. An example of known offsite meal preparation such as Kosher meals was given.
Transport: Most LCA’s include the point of wholesale/retail – so additional transport impact to the event site could need to be considered.
Can we come up with an industry average/estimate for transport impact based on the number of meals provided?
Ownership and Double Accounting: Discussion and guidance is needed to clarify ‘ownership’ in some contexts, for example vendors selling food to attendees as non-ticketed or non-gated events, large workforce contractors that provide meals directly to staff, for-profit participants (such as performance groups, sports teams) who provide accom and catering directly and continually throughout the season.
Attendee meals offsite in hotels (e.g. breakfast or post event dinners) are generally not included. This should be specified in the guidance.
Event-owned food & beverage service should be defined by the principles of financial or operational control.
Meals provided by event stakeholders/delivery partners, to event participants, should be included in the whole reporting boundary of the event, but would be ‘owned’ by the stakeholder. (For example meals provided to sports teams workforces in team bases onsite an event).
Identification of any stakeholders who may take direct responsibility for GHG impacts, but traditional application of ‘financial or operational control’ may indicate it is the event’s responsibility, for example a highly engaged caterer, cleaning contractor, venue.
If you’re ready to learn more about ‘Climate Responsible Events’ check the online courses here

___
A big thanks to all that contributed to this including Joanna Lee (Birmingham 2022 Commonwealth Games), Chris Johnson (Shambala, Vision 2025), Chiara Badiali (Julie’s Bicycle), Shawna McKinley (Clear Current Consulting), Lee Spivak (WM/WM Phoenix Open), Claire O’Neill (A Greener Festival), Susie Tomson (SailGP), Dan Reading (World Sailing/Right Formula), Chris Asensio (Sustainable Golf), Shelley Villalobos (Council for Responsible Sport), Iona Neilson (FormulaE), Craig Simmons (Anthesis Group), Richard Griffiths (Edge Environment) and of course all those who worked on the IOC footprinting guidance and doing the hard work on creating a per-meal EF from WFLDB 2015.